Besides climate, soil is agriculture’s major limitation. All societies are ultimately built on the productivity of the land as neatly summarized in the saying “No soil, no civilization.”
Canada has a large area and a few facts are useful to differentiate the concepts of size and productive area.
- Only 3.2% of our land area can be used to grow crops
- 4.2% can be used as pastureland
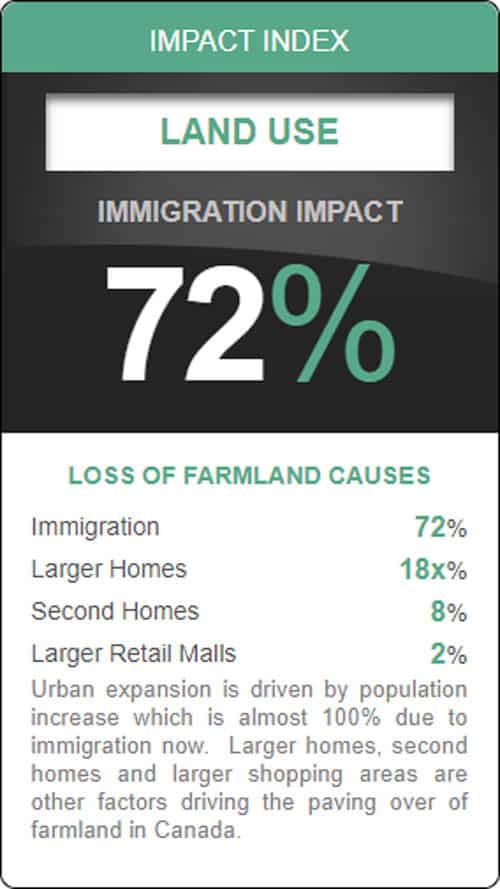
- Soil degeneration and urbanization are responsible for much of the 65% loss of farmland we have suffered in the Maritimes, Quebec and Ontario since 1920
- Each year we lose 20,000 to 25,000 hectares of prime farmland to urban expansion
- For every million people we add to Canada’s population, we lose 530 square kilometers of prime farmland near our large urban areas
Over the past century, artificial fertilizer has been used to boost crop outputs enormously. In effect, worldwide, the food we eat is 75% oil-based. This highlights the need to protect our agricultural lands far more than we have been to prepare for the time when oil will not be nearly as plentiful and cheap as it is today.
When soil loses its fertility and becomes barren, the process is known as desertification. It is happening all over the world and it is important to recognize this trend is occurring in Canada as well. Desertification speeds climate change and climate change speeds desertification. Urbanization, of course, is the ultimate form of desertification.
Whether acting as a reserve to protect food self-sufficiency in a more complex and unstable world or to produce exports to feed countries which cannot feed themselves, our agricultural lands are one of our most vital resources. Agricultural land should not be destroyed simply to make way for subdivisions and shopping malls.
Images of the oil sands provide some of the ugliest illustrations of environmental damage in the world. Contrarily, images of endless forests of new homes built on the best farmland in the world are hailed in the commercial media as evidence of progress and a healthy economy. This is despite the fact that the long term effects of increasing the number of houses, especially on prime farmland, in a northern environment is more damage on a per hectare basis than the mining of the oil sands.
Once the oil sands are processed, (and cleaned) they are benign, neither producing energy or requiring it. Housing developments require energy and material inputs for as long as they exist. They are an environmental sink and beyond the energy to produce the tons of concrete, asphalt, lumber, copper and plastic required in their construction, they need energy every day of the year, for as long as they continue to exist. So when you look at housing developments, particularly on the prime farmland that surrounds most of Canada’s major cities, look beyond the gleaming architecture to the resources, the many equivalent hectares of oil sands that went into them and will be needed in the future.
By adopting a policy of endless population growth and targeting an exceptionally high annual level of immigration equal to or greater than 1% of the Canadian population, the government has essentially committed to building an additional 25 million homes and their supporting roads and commercial buildings on Canada’s best agricultural land.
The commercial media is telling the story through the lens of profit for their advertizers which is growth dependent rather than the lens of public welfare and environmental balance. The endless paving over of farmland is unsustainable as is the energy and material demand these huge cities will place on the earth’s resource base.
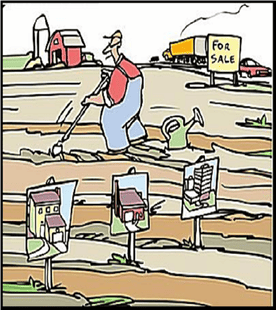
Canada’s agricultural land conservation strategy in one picture.
From 1996 to 2006 Ontario lost 242,820 hectares of agricultural land
The subjects of environmental history, societal collapse and fisheries history are relatively new fields of study. In the past 20 years, huge strides have been made in these fields and they now provide us with a fairly clear window on events of the past.
Unlike those relatively new sciences, agriculture has been studied in depth for millennia and records of crops raised, yields and areas farmed are extensive. There is no mystery as to what contributes to agricultural productivity or to the decline of farmland and the societies which are based on them.
The 1937 study by American researcher Dr. Lowdermilk (USDA Soil Conservation Service) is a classic study of soil and civilization decline in many parts of the world. “Conquest of the Land Through Seven Thousand Years” provides a wonderful overview on soil and civilization for anyone interested in either agriculture, land use or the basic drivers of history.
As Canada paves its way north, it will eventually meet the northern limits of its prime farmland and that will be the end of our ability to both feed ourselves and feed people in other countries.
A growth-forever society places no value on farmland other than the revenue it can generate from year to year. A sustainable society regards farmland as a central pillar of its existence and preserves both the size and the health of this vital resource.
Overview of Agricultural Land Loss Trends
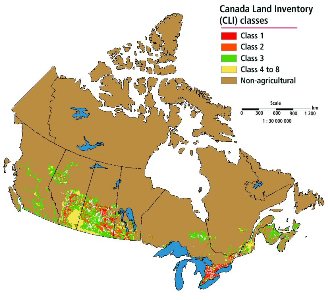
More than 52 percent of Canada’s best farmland—specifically, the land classified as Class 1 by the Canada Land Inventory —is located in Ontario. Class 1 land is the only class of land with no significant constraints on crop production. Most of this land is in southern Ontario where population growth is highest. Thus, one of the results of urbanization in Ontario has been the loss of a substantial portion of the province’s Class 1 farmland. In 1996, over 18 percent of Ontario’s Class 1 farmland was being used for urban purposes. This land is, for all intents and purposes, permanently lost to agriculture.
From Statistics Canada, Rural and Small Town Canada Analysis Bulletin Vol. 6, No. 1 (January 2005), Catalogue no. 21-006-XIE:
- by 2001, Canadian cities and towns had taken over 7400 square km of land traditionally used for farming, more than doubling its incursion into rural areas
- in 2001, there were about 14,300 square km of urban land that had formerly been used for agriculture
- development took over 3% of “dependable agricultural land” and 7% of Canada’s Class 1 agricultural land, considered “the best and most productive” (dependable agricultural land includes Class 1, Class 2, and Class 3 land as defined in the Canada Land Inventory)
- the fruit belts in the Niagara peninsula and Okanagan Valley in British Columbia have lost farmland that was used to grow crops that cannot be grown anywhere else in Canada
- as the amount of prime agricultural land has diminished, the demand for arable territory has increased, forcing farmers to cultivate poorer quality soil
- in 1971, urban areas occupied slightly less than 6% of Class 1land in Ontario; by 2001, they occupied 11% of such land
- in 1971, less than 2% of Class 1 land in Alberta was urbanized; that figure is now more than 6%
- these trends are worrisome because they are essentially permanent
- the federal government should develop a national vision on water and take leadership on the issue
Dependable Agricultural Land
“Comprehensive regional planning with soils maps is essential to allocate soil resources for the future. Urban sprawl not only occupies the best soils, but also creates pressures on other soils that have severe limitations. Thus…comprehensive community planning, with detailed soils maps of large areas, will help to prevent some of the land abuse of the past. The future must be given higher priority than it has been given in the past, if peace, progress and prosperity is to be achieved.”
[2] From Statistics Canada, Rural and Small Town Canada Analysis Bulletin Vol. 3, No. 2 [September 2001], Catalogue no. 21-006-XIE
Urban consumption of Agricultural Land
Urban uses have consumed 12 thousand square kilometres of land since 1971. One-half of this—equivalent to the size of Prince Edward Island—was “dependable” farmland (i.e. Class 1-2-3 land as classified in the Canada Land Inventory).
The urban consumption of agricultural land is partly due to the growing urban population and partly due to new urban households consuming more land per dwelling.
In Ontario, over 18 percent of Class 1 farmland is now being used for urban purposes.
The agricultural land base
In Canada, approximately 673 thousand square kilometres of land is used for agriculture. Although this figure seems large, it represents only 7 percent of Canada’s overall landmass. ….However, not all of the land used for agriculture in Canada is on high-quality agricultural land. That is, some agricultural activities occur on marginal or poorer quality land—land which may not be dependable for long-term agricultural activity.
Dependable agricultural land
Despite Canada’s size, dependable agricultural land is a scarce resource in this country. Limitations such as climate and soil quality reduce the amount of land that is dependable for agricultural activities. We define “dependable” agricultural land as land designated as Class 1, Class 2, and Class 3 by the Canada Land Inventory (McCuaig and Manning, 1982). These classes include all land areas that are not hampered by severe constraints for crop production. It is, in other words, our endowment of good farmland. [Reference: McCuaig, JD and EW Manning. 1982. Agricultural land use change in Canada: Process and consequences. (Ottawa: Environment Canada, Lands Directorate, Catalogue 73-1/21E)]
Only about 5 percent of our land is free from sever constraints on crop production. ….
The fact that 90 percent of Canadians live in a narrow band along the southern border means that the effects of urbanisation in Canada are concentrated in this relatively small area. Since this is the same strip of land where much of the dependable agricultural land is located, one of the major effects of urbanisation is the loss of agricultural land.
Urban land use
Canada’s cities and towns expanded steadily between 1971 and 1996, consuming more than 12 thousand square kilometres in this 25-year period. This expansion is equivalent to more than twice the land area of Prince Edward Island and represents an increase of 77 percent in urban land over the 25-year period. …In terms of sheer size, Ontario and Quebec contain over 55 percent of Canada’s urban land, and not surprisingly between 1971 and 1996, these two provinces also grew the most in terms of the absolute increase in land used for urban purposes. In fact, Ontario’s urban area grew by 3,472 square kilometres—this amount is larger than the total urban area found in any province outside Quebec.
There are various reasons for the expansion of urban areas. Two main factors impacting urban land use are:
a growing population; and
changes in the urban form [i.e. more land per urban dwelling].
Between 1971 and 1996, urban dwellers grew from 16.4 to 22.5 million persons, an increase of 37 percent. This increase in population, combined with the arrival of the baby-boomers on the housing market, increased the demand for housing. The preference in location and type of home also changed and accelerated the expansion of urban areas…..
Of the total amount of land converted to urban uses between 1971 and 1996, about half, or 5.9 thousand square kilometres, was dependable agricultural land. this loss of dependable agricultural land over 25 years is equivalent to the total land area of Prince Edward Island. By 1996, urban land in Canada occupied 3.2 percent of the dependable land in the country, as indicated by the Canada Land Inventory Class 1-2-3 land area.2
[2 This figure does not include the amount of dependable land occupied by large urban areas prior to the development of the Canada Land Inventory in 1966. Neither does it include areas occupied for non-agricultural purposes outside cities, such as road and utility networks.]
More than 52 percent of Canada’s best farmland—specifically, the land classified as Class 1 by the Canada Land Inventory —is located in Ontario. Class 1 land is the only class of land with no significant constraints on crop production. Most of this land is in southern Ontario where population growth is highest. Thus, one of the results of urbanisation in Ontario has been the loss of a substantial portion of the province’s Class 1 farmland. In 1996, over 18 percent of Ontario’s Class 1 farmland was being used for urban purposes. This land is, for all intents and purposes, permanently lost to agriculture….
Although in some regions, the loss of agricultural land to urban uses appears to be small, this measure does not take into account two important issues [Environment Canada, 1996]:
In some regions, urbanisation of agricultural land affects specialty crops that have a limited ability to flourish in Canada. In addition, these products often represent an important resource to the local economy [e.g. the fruit belts in the Niagara and Okanagan regions]. In these cases, the loss of each square kilometre is significant.
Cities also impact the use of surrounding land in indirect ways. For instance, golf courses, gravel pits and recreational areas are often located on agricultural land in areas adjacent to urban areas.
Thus, the effects of urban areas extend beyond their physical boundaries.
[3] From Statistics Canada, Rural and Small Town Canada Analysis Bulletin Vol. 6, No. 1 [January 2005], Catalogue no. 21-006-XIE
In 2001, about one-half of Canada’s urbanized land was located on dependable agricultural land.
Between 1951 and 2001, the supply of dependable agricultural land declined by 4 percent, while the demand for cultivated land increased by 20 percent. [Cultivated land includes cropland, summer fallow, and tame or seeded pasture].
In 2001, urban uses covered 14,300 square kilometres of dependable agricultural land. This was more than double the 1971 level of approximately 6,900 square kilometres. When urban land is combined with that used for small rural settlements [those with populations under 1,000], farmsteads and rural housing lots, over 23,200 square kilometres of dependable agricultural land had been lost to possible agricultural use by 2001. Transportation and utilities consumed another 11,700 square kilometres. Losses to urban and rural build-up and transportation and utilities can be considered permanent. In addition to those losses, 5,500 square kilometres of land were lost to protected areas, campgrounds and other uses from which it could be reclaimed [i.e., not permanent]. [See Table 2 on page 9 of Rural and Small Town Analysis Bulletin Vol. 6, No. 1]
As of 2001, urban land in Canada occupied approximately 3 percent of all dependable agricultural land.* More importantly, it occupied 7.5 percent of our very best agricultural land that was classified as Class 1 in the Canada Land Inventory.** [*This figure does not include the amount of dependable agricultural land occupied by large urban areas prior to the development of the Canada Land Inventory. **Class 1 land is Canada’s only land with no significant constraints to crop production.]
The provinces of Ontario, Manitoba, Saskatchewan, and Alberta are home to 99 percent of Canada’s Class 1 agricultural land. More than 56 percent of this land is concentrated in Ontario alone and most of this is in the heavily urbanized southern part of the province. One of the results of urbanization in Ontario has, therefore, been the loss of a substantial part of Ontario’s Class 1 agricultural land.
As of 2001, over 11 percent of Ontario’s best agricultural land was being used for urban purposes [that is, permanently lost to agriculture]. By 2001, Alberta had lost over 6 percent of its agricultural land.
The table below is from Rural and Small Town Canada Analysis Bulletin Vol. 6, No. 1, pg. 9 Table 2
Year |
Urban and rural build-up (1) |
Transportation and utilities (2) |
Protected areas and campgrounds |
Other (3) |
Total |
|---|---|---|---|---|---|
|
1951 |
11,400 |
7,400 |
1,000 |
200 |
20,000 |
|
1961 |
12,600 |
7,400 |
1,100 |
300 |
21,400 |
|
1971 |
14,300 |
8,200 |
1,300 |
500 |
24,300 |
|
1981 |
18,000 |
9,800 |
1,500 |
1,100 |
30,400 |
|
1991 |
21,100 |
10,600 |
2,100 |
1,700 |
35,500 |
|
2001 |
23,200 |
11,700 |
3,400 |
2,100 |
40,400 |
Notes: Figures are rounded to the nearest 100.
- Includes inventoried human settlements with populations above 1000, settlements with a population under 1000, and rural farmsteads/housing lots.
- Includes roads, railways, airports and utility transmission lines.
- Includes lumberyards, sewage treatment facilities, dumps, Fedral Real Property, cemeteries, pits, quarries, autowreckers, and golf courses.
Source: Statistics Canada, Environment Accounts and Statistics Division
Table 1. Regional Population Trends and Forecasts for Ontario.
Region |
1986 Population |
2004 Population |
% Change |
2006 Forecast |
2026 Forecast |
% Change |
|---|---|---|---|---|---|---|
|
GTA |
3,903,128 |
5,654,345 |
44.9 |
5,858,000 |
7,748,000 |
32.3 |
|
Central |
2,059,316 |
2,711,416 |
31.7 |
2,781,000 |
3,437,000 |
23.6 |
|
East |
1,316,788 |
1,629,060 |
23.7 |
1,679,000 |
2,008,000 |
19.6 |
|
Southwest |
1,331,205 |
1,569,111 |
17.9 |
1,594,000 |
1,851,000 |
16.1 |
|
Northeast |
583,611 |
566,309 |
-3.0 |
560,000 |
524,000 |
-6.5 |
|
Northwest |
244,084 |
244,057 |
0.0 |
242,000 |
228,000 |
-5.5 |
|
Total |
9,438,132 |
12,374,298 |
31.1 |
12,713,000 |
15,795,000 |
24.2 |
As documented in background papers prepared for Places to Grow, much of the growth in the Greater Golden Horseshoe will occur on the fringes of existing urban centres on greenfield sites. The Ontario Ministry of Public Infrastructure Renewal estimates that over the next 25 years, the GTA and Hamilton will grow by 2.7 million people, and that the population of the outer ring of the Greater Golden Horseshoe (GGH) will increase by 900,000. The GGH will also need to accommodated about 1.5 million new jobs, 370,000 of which will be located beyond the Niagara Escarpment, the Greenbelt and Oak Ridges Moraine.5 (5 Ontario Ministry of Public Infrastructure and Renewal. (2006) Growth Plan for the Greater Golden Horseshoe. )
2.2. Rapid population growth in Southern Ontario is driven by immigration
The principal source of population growth in Ontario is immigration. The impacts have largely been felt in Canada’s three major metropolitan urban areas, Toronto, Vancouver and Montreal, which have served as the catchment areas for virtually all immigration over the past 30 years. The GTA and Hamilton attract the highest level of immigration of all, more than 50 percent of the total. Assuming that current rates continue, it is forecast that the Greater Golden Horseshoe Area will be home to at least one million new immigrants by 2031.
http://ontariofarmlandtrust.ca/about/whysavefarmland/
Ontario Farmland Trust
Saving Farmland
Ontario's Agricultural Land is at Risk
Ontario is blessed with some of the best farmland in Canada. Only 0.5 percent of all of Canada’s land is considered class 1 farmland (according to the Canada Land Inventory), which means it has no significant limitations for farming and has the highest productivity for a variety of crops. More than half of this land is found in Ontario.
Despite its obvious importance, Ontario is losing its agricultural land base at a rapid rate as many farms go out of production every year. Urban sprawl and rural non-farm development are contributing to the annual loss of thousands of acres of farmland. Flat, cleared, agricultural land is not only easily developed, it is also very affordable to developers who are seeking to meet the demand for land to accommodate urban growth. It is often far more financially profitable in the long term for a farmer to sell his or her land knowing that it may be converted to some non-agricultural land use, than to continue farming.
In the Greater Toronto Area (GTA) alone, more than 2,000 farms and 150,000 acres of farmland were lost to production in the two decades between 1976 and 1996. This represented approximately 18% of Ontario’s Class 1 farmland. Although farmland loss is not tracked as extensively today as it was in previous decades, we know that the amount of farmland in the GTA decreased by at least 50,000 acres between 1996 and 2001 and that Ontario lost at least 600,000 acres of farmland between 1996 and 2006. It can take thousands of years to produce one centimeter of the topsoil needed for agricultural production. For this reason, Ontario’s farmland should be seen as a limited natural resource, to be managed and protected.
Why Save Farmland?
Protecting farmland helps to preserve a productive land base for the agricultural economy, preserve the amenity values of open space and rural character, slow suburban sprawl, provide wildlife habitat, and provide an opportunity for groundwater recharge in areas where suburban development is occurring.
Food Security and Local Food Supply
Preserving farmland helps ensure a continued supply of locally grown produce as a growing number of consumers are revealing their preference for and supporting the provision of local sources of farm products. People are choosing local in order to obtain fresher products, avoid lengthy transportation, and support the local agricultural economy. Direct-to-consumer markets include pick-your-own operations, roadside stands, farmer’s markets, direct farm markets and community supported agriculture.
If Ontario should ever need or choose to be self-sufficient in the production of its food it is critical that we take action now to protect our remaining productive soils. Oil shortages and rising prices may put a premium on local production rather than global marketing.
Economic Benefits
The Ontario farm and food processing sector generates over $30 billion in sales – more than 35 percent of Canada’s Agri-Food sector gross domestic product – and employs 700,000 people.
Saving farmland also provides fiscal stability for local governments. New development requires services such as schools, roads and fire/police protection, whereas privately owned and managed agricultural land requires very few services. Cost of Community Services studies in both the U.S. and Canada show that farmlands more than pay for the municipal services they require, while taxes on residential use, on average, fail to cover costs.
Protection of the Environment
Well-managed agricultural land supplies important non-market goods and services for our environment. Farmlands provide food and habitat for wildlife, help control flooding, protect wetlands and watersheds and maintain air quality. They can absorb and filter wastewater and provide groundwater recharge.
- W.C. Lowdermilk – Simply a brilliant study of soil and civilization decline though the ages of human history. Soil expert travels the world in the 1930’s.
- StatcsCan – In 1996, over 18 percent of Ontario’s Class 1 farmland was being used for urban purposes. This land is, for all intents and purposes, permanently lost to agriculture.
- The Globe and Mail – Canada has lost its status as a food-producing superpower and needs a drastic overhaul of its agricultural policy if it hopes to compete in world markets and feed more of its own people
- Sierra Club Canada – Rampant suburban sprawl development in Ontario’s metropolitan areas has led to chronic traffic jams, conflicts over the use of green space and soaring public costs to service growth.
- Abbe Hamilton – Many neoclassical economists, other technology supporters and some empiricists argue that technological advancements will allow indefinite growth in agricultural productivity.
- Stats Canada – The Loss of Dependable Agricultural Land in Canada (Rural and Small Town Canada Analysis Bulletin
- Food, Land, Population and the U.S. Economy – This focuses on the interrelated nature of the economy, population growth, and environmental degradation.